↓Prevention of defective product outflow ↓Diverse and easy-to-use data collection screens
↓Extensive statistical analysis ↓Alarm function warns operators of abnormalities Case study
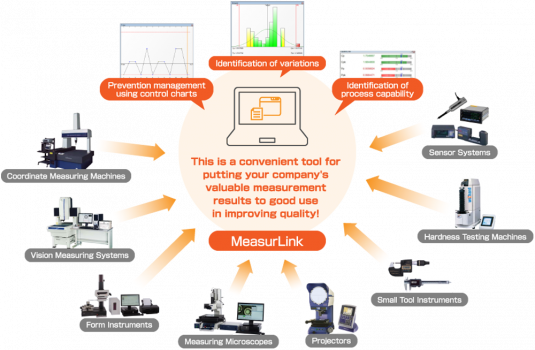
Using production floor data, build SPC (statistical process control) so that only good-quality products are produced.
The "MeasurLink" measurement data network system gathers data from various types of measuring equipment and generates
real-time displays of the results of statistical processing (control charts, histograms, process capability indexes, etc.).
The result is SPC.
Prevent scrap;
produce only good-quality products
Gather real-time data from all network-connected measuring devices and then forecast defect occurrence using statistical process control.

Put your company's valuable measurement results to good use in improving quality.
The quality of tomorrow's products can be known today
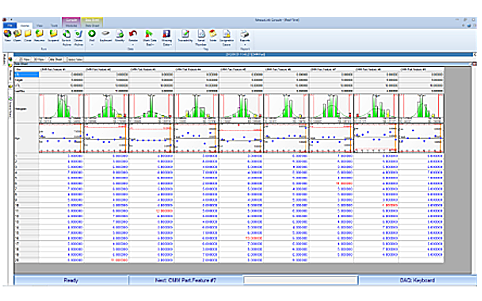
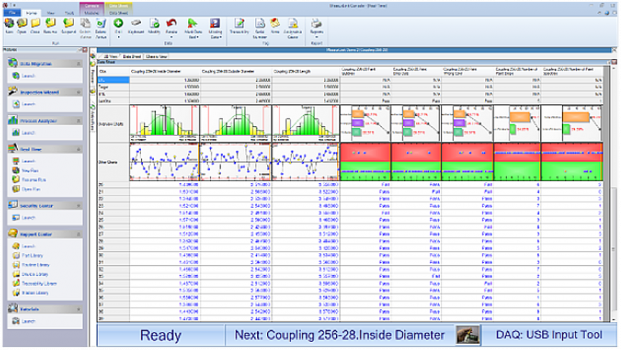
Diverse and easy-to-use data collection screens
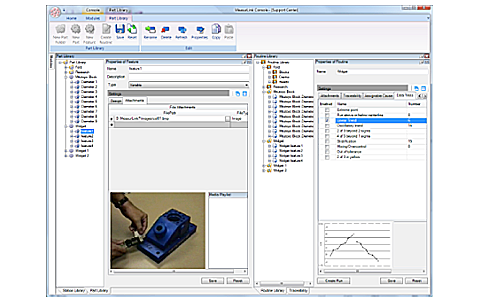
Diversely varied data collection screens are provided, including statistical analysis results, data lists, work instruction image displays, etc. Screen displays can be easily switched to match operator objectives.
Data sheet

Individual measurement values can be displayed in tabular format to show multiple measurements in an easy-to-understand manner.
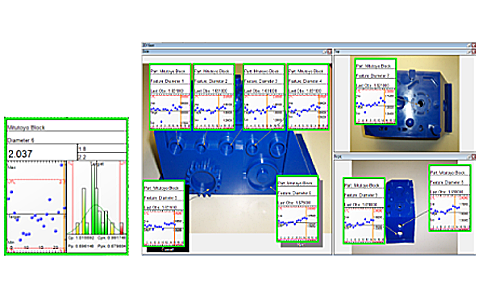
2D view

With work photos and drawing data in the background, measurements can be displayed using connecting lines, and these documents can be used in place of work orders. Also, the results of tolerance judgments can be shown with frame colors.

Extensive statistical analysis functions are supported (Xbar-R control charts, run charts, etc.)
Using the diverse range of statistical analysis and display functions, you can obtain results applicable to your particular situation and objectives.
| [Charts] | [Statistics] |
 |
 |
| Continuous values: Xbar-R, Xbar-s, X-Rs, EWMA control charts, histograms, run charts, pre-control charts, tier charts, box plot charts, meter charts, indicator bars, multivariate control charts, etc. Measurement values: p, np, c, and u control charts; Pareto diagrams; and pie charts. |
Maximum value, minimum value, standard deviation, average ±3σ/ 4σ/ 6σ, process capability indexes (Cp, Cpk, Pp, Ppk), defect rate, etc. |
Alarm function warns operators of abnormalities
A warning is sent to the operator when abnormalities (Out of Tolerance, Out of Control Limit) occur. The warning method can be selected as a pop-up window display, email notification, log file entry, etc.
Would you like to find out more about our Smart Factory solutions?
Please fill in the form – it will help us to handle your product or service inquiry more efficiently.
Send us your inquiry